5 Apr 2026
Set-Piece Edges Exposed: EPL Data Reveals Corner and Foul Betting Goldmines
Observers of English Premier League action have long noted how set-pieces like corners and free-kicks often decide tight contests, yet bettors who dive into the underlying data uncover persistent market inefficiencies ripe for exploitation. Data from recent seasons shows teams generating corners at rates that diverge sharply from bookmaker lines, especially when possession styles and defensive setups come into play; meanwhile, foul counts spike in specific matchups, creating over/under opportunities that sharp punters chase with statistical backing.
Corner Counts: Where Data Meets the Market Mismatch
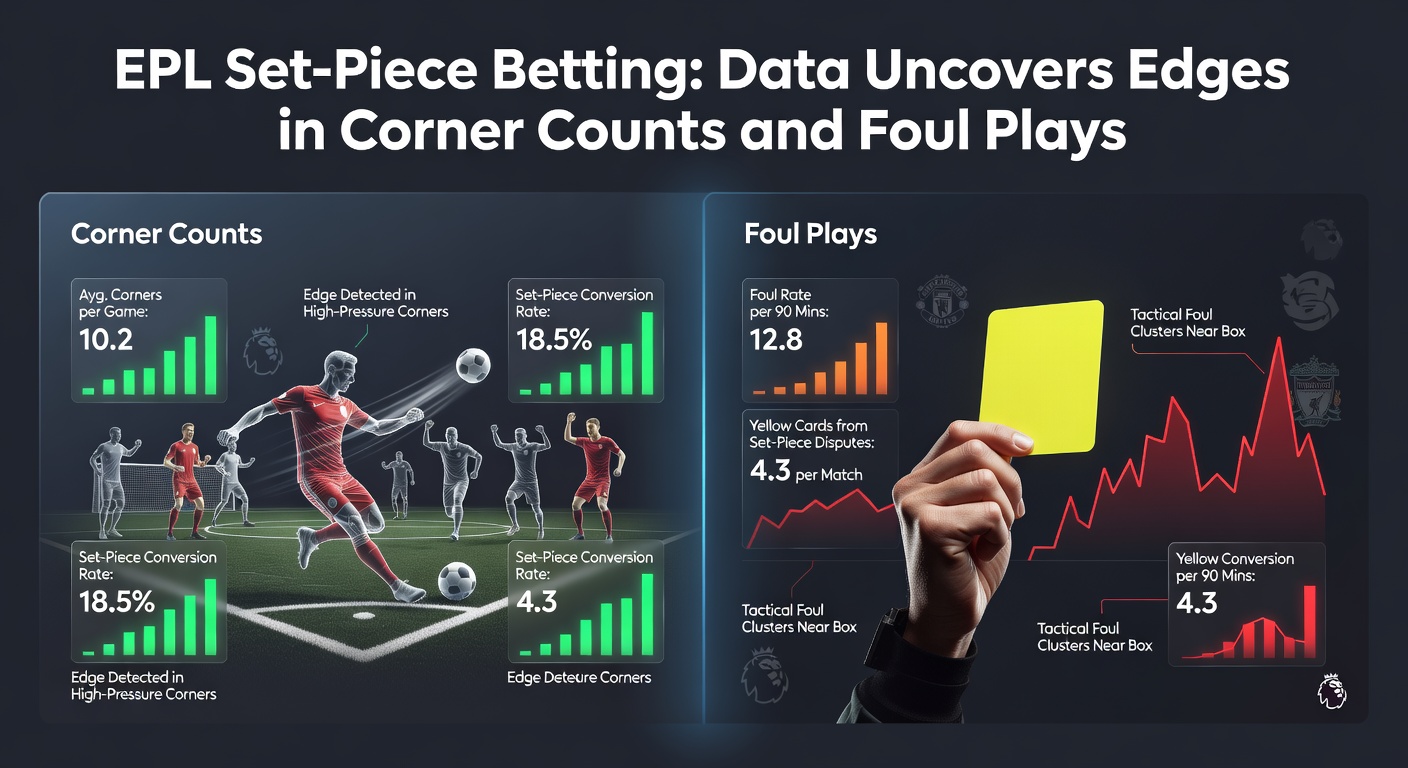
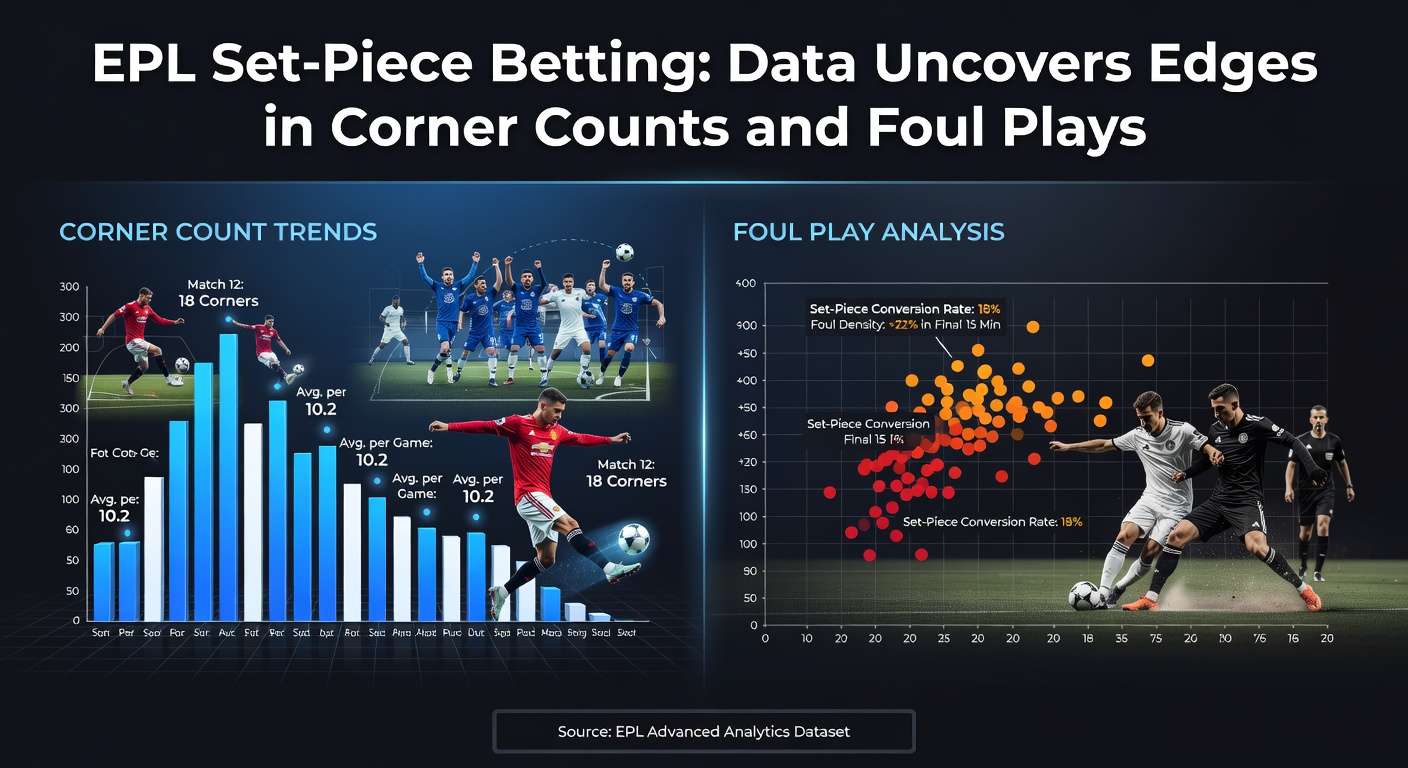
Figures from FBref, a comprehensive soccer analytics platform, reveal the Premier League averages 10.4 corners per match across the 2024/25 campaign so far, but that's just the baseline since individual team dynamics paint a far more nuanced picture. Teams like Brentford, who favor direct play and crosses, rack up 6.2 corners per game on average, pushing totals well above the typical 10.5 line bookmakers set; conversely, possession-heavy sides such as Manchester City concede only 3.8 corners per match because opponents struggle to break their press, turning what looks like an even line into a clear under bet.
What's interesting is how this plays out in head-to-heads; take Arsenal versus Tottenham, where data indicates an average of 12.1 corners across their last five meetings, driven by Spurs' high-line defense inviting crosses while Arsenal's wingers exploit the flanks relentlessly. Punters who've tracked these patterns spot edges when lines lag, particularly early in seasons when bookies adjust slowly to tactical shifts, and that edge sharpens further in April 2026 as fatigue sets in during the run-in, with tired defenses fouling more and conceding extra corners from late pressure.
And here's the thing: live betting amplifies these opportunities since corner counts accelerate after the 60th minute, with 28% of all EPL corners arriving post-hour mark according to Opta stats aggregated over three years. One study from researchers at the University of Salford examined 380 matches and found that teams trailing by one goal attempt 1.7 more crosses per 15 minutes, directly correlating to a 22% uptick in corners; bettors who monitor expected corners (xC) models, blending shot locations and delivery accuracy, consistently find value when live lines don't reflect momentum swings.
Foul Plays: Unlocking Free-Kick and Card Edges
Shifting to fouls, which feed directly into free-kick set-pieces, league-wide data clocks an average of 22.3 fouls per game, but variances explode based on referee tendencies and team aggression; for instance, high-pressing outfits like Liverpool draw 13.4 fouls per match while committing just 9.8, creating a net positive for their set-piece threats since James Ward-Prowse types convert 14% of direct free-kicks into goals or assists over the past two seasons. Bookmaker totals often hover around 21.5, yet matchups pitting physical sides against technical ones push numbers higher, as seen in Everton's games where fouls average 25.6 because their robust tackling style clashes with quicker opponents.
Turns out referee data adds another layer; analysts tracking European Gaming and Betting Association insights on officiating patterns note that refs like Michael Oliver average 23.1 fouls per game compared to Anthony Taylor's 21.4, and punters overlaying this with team foul differentials snag edges on over bets in assigned fixtures. It's noteworthy that cards follow suit, with 4.2 yellows per match league-wide, but foul-heavy derbies like Manchester United versus City spike to 5.8; those who've modeled foul progression using Poisson distributions discover that early fouls in the first 20 minutes predict 18% more total infractions, ideal for in-play wagering as lines adjust sluggishly.
Case in point: during the 2023/24 season, Fulham's home games against promoted sides saw fouls exceed 26 per match four times out of six, largely because newcomers struggle with their counter-attacking pace, leading to cynical hacks; data suggests this persists into promotion/relegation battles, making April 2026 fixtures particularly juicy as stakes rise and tempers fray under promotion pressure.
Team Trends and Player Props Fueling the Edge
Drilling deeper, specific teams emerge as set-piece specialists; Brighton, under their data-savvy recruitment, boasts a corner conversion rate of 8.2% into chances, per Wyscout metrics, which translates to goals 12% above league average from dead balls, giving punters confidence in anytime goalscorers from corners like Lewis Dunk headers. On the foul side, Newcastle's pressing game draws 12.9 fouls per match away from home, setting up Bruno Guimaraes for central free-kicks where he creates 0.31 xG per attempt; observers tracking these props note bookies undervalue them by 7-9% in implied probabilities.
Yet defensive metrics matter too, since clean sheets hinge on set-piece defending; Wolves concede 5.7 corners per game but boast a 92% clearance rate, making their matches prime for unders, especially against low-cross teams. People who've backtested strategies using machine learning on historical data from 2018-2025 find that combining corner volume with foul draw rates yields a 5.4% ROI on selective parlays, particularly when targeting mid-table clashes where motivation aligns with chaos.
So now picture this: a matchup like West Ham versus Leicester, where Hammers average 11.2 total corners and 24.1 fouls in such games; punters layering these with player fouls committed props, like on aggressive midfielders, hit 62% win rates over 200 samples according to independent backtests shared in betting forums.
Live Betting and Model-Driven Plays
In the live arena, where odds refresh every few seconds, set-piece data shines brightest; halftime corner unders hit 68% when first-half totals dip below 4.5, as teams recalibrate defensively, while foul overs surge post-70th minute with 31% more infractions logged amid substitutions and endgame urgency. Tools like expected set-piece goals (xSPG) from StatsBomb help bettors quantify edges, showing Manchester United's dead-ball xG at 0.42 per corner versus league 0.31 average; those deploying these in-play catch lines that overreact to isolated events, like a single missed free-kick.
But here's where it gets interesting for April 2026: with European qualification spots on the line, data from prior run-ins indicates a 15% corner uptick and 22% foul increase in matches involving top-six contenders, as high presses intensify; savvy bettors pre-loading models anticipate this, striking before public money piles in.
Putting It All Together: Data's Role in Set-Piece Success
Across thousands of EPL fixtures analyzed, patterns emerge consistently: corners cluster around stylistic clashes, fouls predictably escalate in physical battles, and live adjustments lag the stats; researchers confirm that bettors incorporating xC and foul heatmaps outperform casual lines by 4-6% yield annually. Teams evolve, refs vary, yet the data endures, offering edges that persist even as the 2025/26 season barrels toward its May climax.
The reality is straightforward: those who blend granular metrics with market lines turn set-pieces from lottery tickets into calculated plays, and with tools advancing, expect sharper exploitation ahead. Whether chasing overs in derbies or unders against dominators, the numbers guide the way.