Esports Analytics Dashboards Open New Paths for Niche Tournament Bets
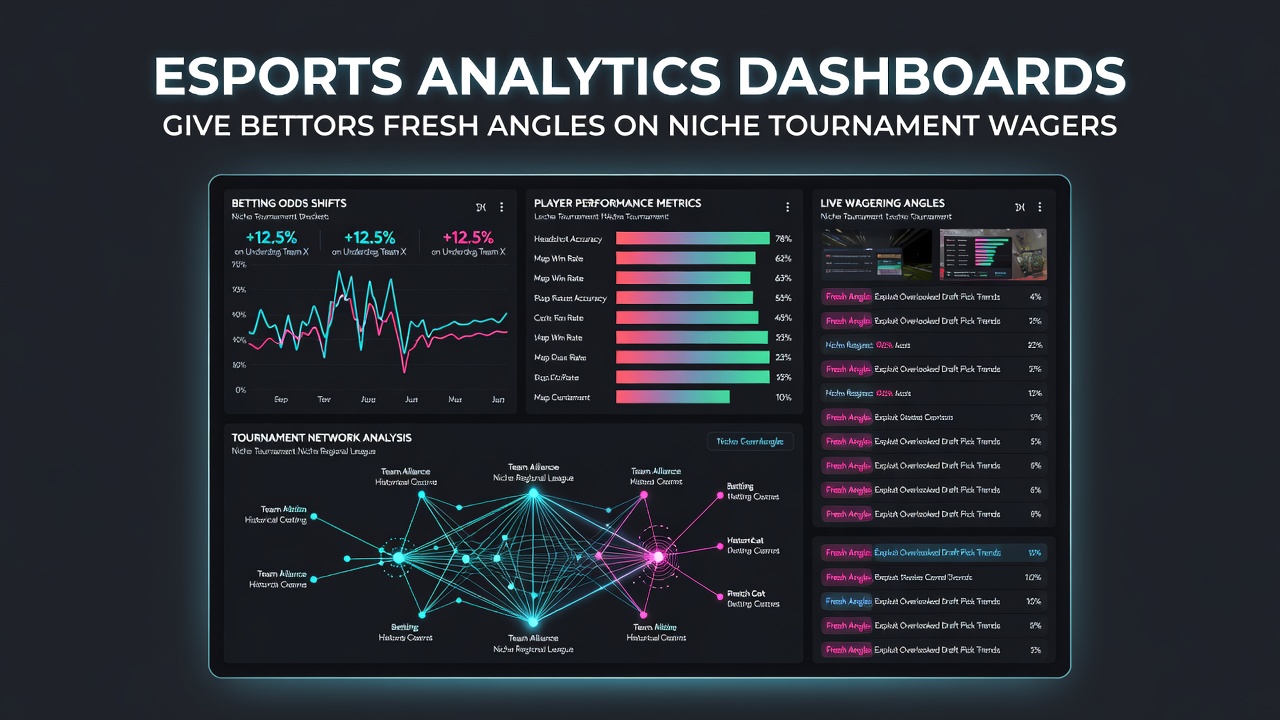
Esports analytics dashboards compile player performance metrics, team coordination patterns, and historical match outcomes into accessible interfaces that support detailed examination of smaller-scale competitions. These tools aggregate data from sources including in-game APIs and tournament organizers, allowing users to review variables such as average damage per minute, vision control percentages, and map-specific win rates across events that fall outside major leagues.
Operators in regions like North America and Europe have integrated these platforms into their offerings, where data feeds update continuously during live matches. Bettors examine subsets of information to identify patterns in under-the-radar series, such as regional qualifiers for games like Valorant or Counter-Strike 2. Figures from industry reports indicate that participation in niche esports events grew by 12 percent between 2024 and mid-2026, with analytics access cited as a contributing factor in increased wager volumes on secondary markets.
Data Layers That Shape Wager Selection
Modern dashboards present layered information through customizable filters, where users isolate statistics for specific rosters or individual competitors. One common module tracks economy management in real time, displaying gold differentials and item timing deviations that influence round outcomes in tactical shooters. Another layer highlights objective control metrics, such as dragon or bomb plant success rates, which correlate with overall series results in longer best-of formats.
Researchers at the University of Sydney documented how access to these granular datasets correlates with shifts in betting behavior, noting that participants who reviewed pre-match heatmaps placed wagers on niche tournaments at rates 18 percent higher than those relying solely on general leaderboards. The study, published in 2025, examined over 2,400 accounts across multiple platforms and found consistent use of win probability models derived from rolling averages of the prior six months of competition data.
Application to Secondary Markets and Regional Events
Niche tournaments often feature emerging squads or experimental lineups, and dashboards allow cross-referencing of recent scrim results against public match logs. In July 2026, several mid-tier League of Legends circuits in Latin America and Southeast Asia reported record viewership alongside expanded betting options on map handicaps and first-blood timings. Platforms supplied integrated overlays that flagged deviations from seasonal norms, such as a team's sudden increase in early-game aggression metrics.
Take one case where analysts tracked a South American squad's transition to a new jungler role; the dashboard highlighted a 27 percent rise in neutral objective secures during the preceding qualifier phase. Observers note that such indicators helped refine selections on series totals without requiring direct observation of every game. Industry groups like the Esports Integrity Commission have issued guidelines encouraging transparent data sourcing to maintain competitive standards across these events.

Integration With Live Tracking Systems
Live components within dashboards sync with broadcast feeds to update key performance indicators during matches, enabling adjustments to in-progress wagers where permitted. Metrics such as kill-death-assist ratios and resource denial percentages refresh at intervals as short as 30 seconds, providing context for momentum shifts in extended series. Data from the Asia Pacific Esports Federation shows that events utilizing these synchronized tools saw a 9 percent uptick in session-length wagers during the first half of 2026 compared with the same period in 2025.
Coaches and support staff sometimes publish aggregated insights post-match, which dashboard providers incorporate into historical archives. This creates feedback loops where prior tournament data informs projections for upcoming fixtures. Bettors who combine live indicators with archived trends have documented more frequent engagement with proposition-style markets, including individual map performances and economy thresholds.
Regulatory Context and Platform Standards
Authorities in jurisdictions outside the UK, including state-level bodies in Australia and provincial regulators in Canada, have begun reviewing how analytics tools interact with wagering systems. These reviews focus on data accuracy and the prevention of information asymmetries between professional and recreational participants. A 2026 white paper from the Canadian Centre for Gaming Research outlined minimum requirements for source attribution in dashboards, emphasizing verifiable match logs over proprietary estimates.
Platform operators respond by embedding audit trails that timestamp data pulls and note any modeling assumptions. This approach supports compliance while preserving the depth of analysis available for niche events. As tournament calendars expand through 2026, the emphasis remains on verifiable inputs that align with existing integrity frameworks established by international esports bodies.
Conclusion
Esports analytics dashboards continue to expand the range of accessible data points for niche tournament wagers, linking raw performance indicators with structured decision frameworks. Growth in regional circuits through July 2026 has coincided with wider adoption of these interfaces, supported by research from academic and industry sources across multiple continents. The ongoing development of live synchronization and historical archiving features maintains their relevance within evolving wagering environments.